Neighborhood Movement Methodology
Overview
Exploring neighborhood movement leverages data from Opportunity Insight’s Opportunity Atlas (OA) to map neighborhood movement across Dallas County. The interactive tool developed in this approach serves to find locations where further analysis and information, including resident stories, can provide insight into how neighborhoods change (e.g. gentrification) and which ones present greater opportunities for economic mobility.
This document outlines the technical aspects of data development and analysis for presentation in the tool.
Framework and Core Questions
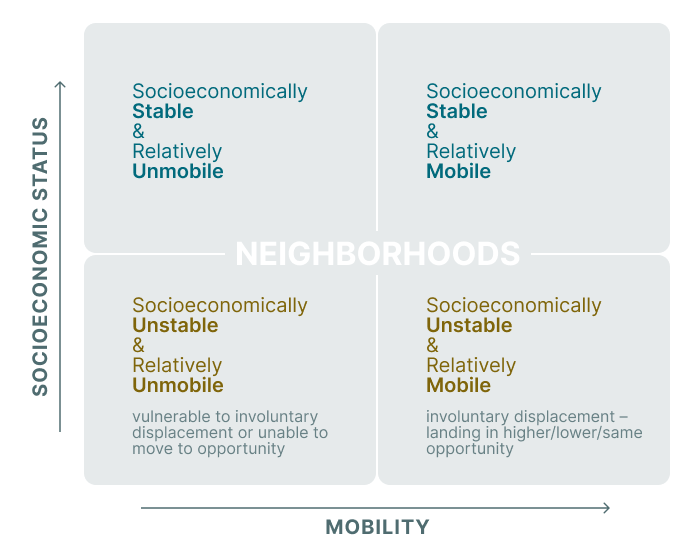
Neighborhoods evolve over time with respect to their socioeconomic and demographic traits and exhibit various degrees of condition based on this conceptual framework.
Examining connections between movement and opportunity resulted in the following questions of the data available from the OA.
- What share of individuals in neighborhoods moved from the neighborhood where they grew up?
- To what extent did movement change relative to shifts in economic opportunity (income)?
Follow up questions related to the current picture of socioeconomic and demographic characteristics in neighborhoods.
- What are the current household incomes?
- What are the current demographic characteristics?
- What is the current picture of child poverty?
Data Sources
Most of the base variables were downloaded directly from the OA. Current (2023) variables were downloaded from the National Historical GIS (NHGIS) website to assess demographic and economic changes from the endpoint of the OA data in 2015.
A note on boundary changes
Modernizing the 2023 ACS variables; The challenge here is the geographic units are 2020 vintage boundaries, while the OA variables are reported in 2010 geographies. To adjust these variables to the 2010 OA framework, the 2020 to 2010 crosswalk from NHGIS was applied. For the population, the crosswalk process is straightforward. In the case of median household income, the variable poses a challenge for census tracts that either split or merged in the new decade (2020) because the full distribution of the data is not available. An accommodation was made by using more detailed data from the complete set of summary (base) tables provided, specifically that [med_hh_inc] (median household income) can be paired with variables from household income (e.g. [HHInc0], [HInc10], ..., [HHInc200]) that form a distribution table from which a median could be estimated. An estimate of the median values was taken by their weighted averages. The result is a weighted average of the medians of the components, but it is not the median of the aggregate. It may not be the actual median, but it is still a not bad measure of the typical, middle value of the distribution.
Movement and economic wellbeing Indicators
tr_share_move: The percentage of people who moved away from the tract where they grew up. This is the inverse of the original OA variable that reported the percentage of people who had stayed in the tract where they grew up.
tr_ind_inc_all: Individual income in 2015 (excluding spouse) at age 35 in the tract where they grew up.
cz_ind_inc_all: Individual income in 2015 (excluding spouse) at age 35 in the tract where they grew up and stayed in commuting zone (Dallas metro).
med_hh_inc_23: The median household income in 2023.
u18_23: The population under 18 in 2023.
per_his_lat_23: Hispanic or Latino percentage of the population in 2023.
per_white_nh_23: White, not Hispanic percentage of the population in 2023.
per_black_nh_23: Black not Hispanic percentage of the population in 2023.
per_all_other_nh_23: All other not Hispanic percentage of the population in 2023.
per_child_pov_23: Percent of children below poverty level in 2023.
per_all_pov_23: Percent of population below poverty level in 2023.
Approach
With a focus on movement and economic outcomes, comparing only the two census tract outcomes of movement (tr_share_move) and income (tr_ind_inc_all) provides a simple picture. However, understanding these dynamics within the larger economic context helps to establish where concentration and outliers exist, and thus where to direct attention for further inquiry. With this in mind, the following key variables from the OA were included in the analysis.
- The percentage of people who moved away from the census tract where they grew up (tr_share_move),
- The average individual income of people who grew up in the census tract regardless of whether they moved (tr_ind_inc_all),
- The average individual income of people who grew up in the census tract and remained in the commute zone (cz_ind_inc_all).
These variables formed the basis of the analysis to assess the relative performance of each census tract for both movement and economic well-being, and with respect to the metro/commute zone. First, movement, as the share of people who moved away from the tract they grew up in (tr_share_move) is compared with incomes of individuals, regardless of whether they moved or stayed (tr_ind_inc_all) in the Income vs Mobility layer. Second, incomes of individuals, regardless of whether they moved or stayed (tr_ind_inc_all) is compared with incomes of individuals who remained in the region (cz_ind_inc_all). The latter serves as a proxy for incomes of those who “left” the region to versus those who remained in the region in the Income Change if Left Region layer.
Finally, in order to provide a picture of more current (2023) economic and demographic conditions, the variables on median household income, child poverty and race and ethnicity were included to overlay with the economic mobility outcomes through 2015.
Data Investigation
Each input variable was examined for geographic completeness and distribution. The results revealed each variable, representing movement and income, have regular distributions (for the larger metropolitan area).
Note: Unfortunately, there is limited geographic coverage and/or completeness across all available race/ethnicities for movement and economic wellbeing. At this time, it was decided to hold off cuts by other demographics for simplicity in communicating this work for the initial launch. Pending interest from the initial launch, adding results by demographics could be revisited.
Limitations for Longitudinal Analysis
The primary limitations of this inquiry are the age of the data currently available through the Opportunity Atlas (2015), and the lack of an origin-destination file to understand where people moved over time. While this is an initial challenge, there are opportunities to establish a movement tracking database moving forward as a complement to the baseline tool.